Solo CSC 466 data-mining project · Fall 2025
Student Success Prediction
What predicts student dropout before and after college begins?
- Python
- pandas
- scikit-learn
- XGBoost
- Jupyter
- seaborn
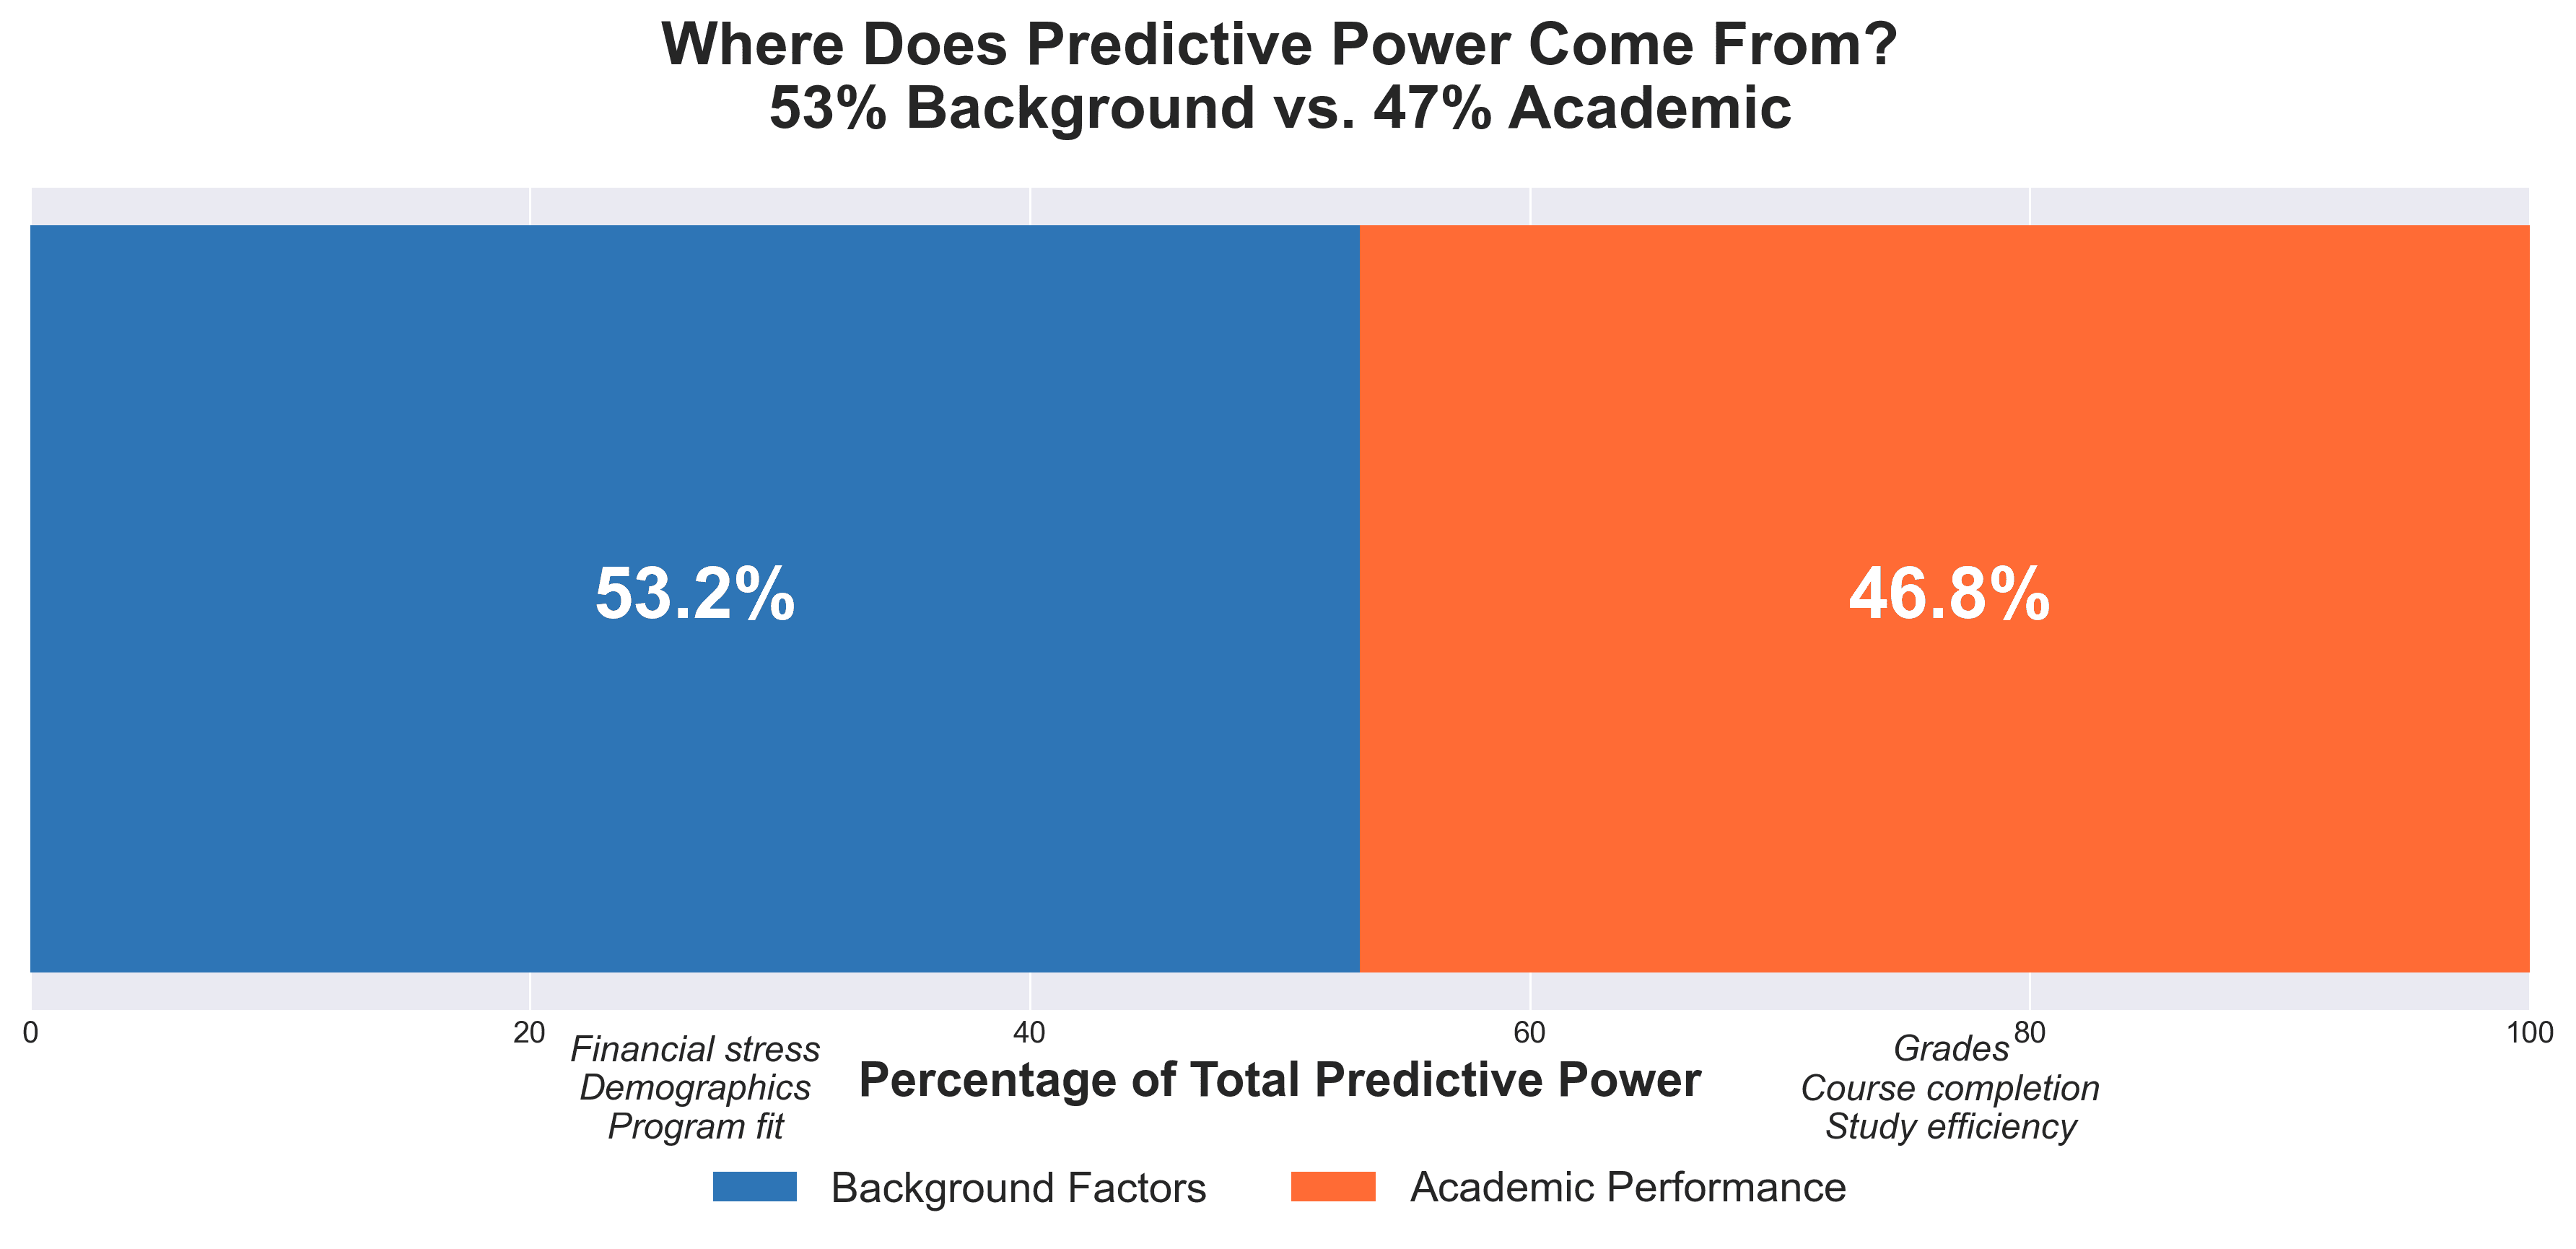
53 / 47
background vs. academic predictive lift
when does useful dropout signal become available?
A model using final-semester performance may predict dropout well but arrive too late to support a student. I treated admission and post-enrollment data as two different decision moments and measured what each stage added.
This was a solo, end-to-end analysis of 4,424 UCI student records, not a deployed intervention system. The proposed two-stage support framework is an interpretation of the evidence, not a product currently making decisions about students.
one dataset, two usable moments
Admission view
Sixteen features available before semester grades ask how early a meaningful signal exists.
Full view
Twenty-four features add curricular progress and semester performance to measure the later lift.
Model comparison
A dummy baseline, logistic regression, random forest, gradient boosting, and XGBoost are compared under the same split and cross-validation protocol.
Intervention framing
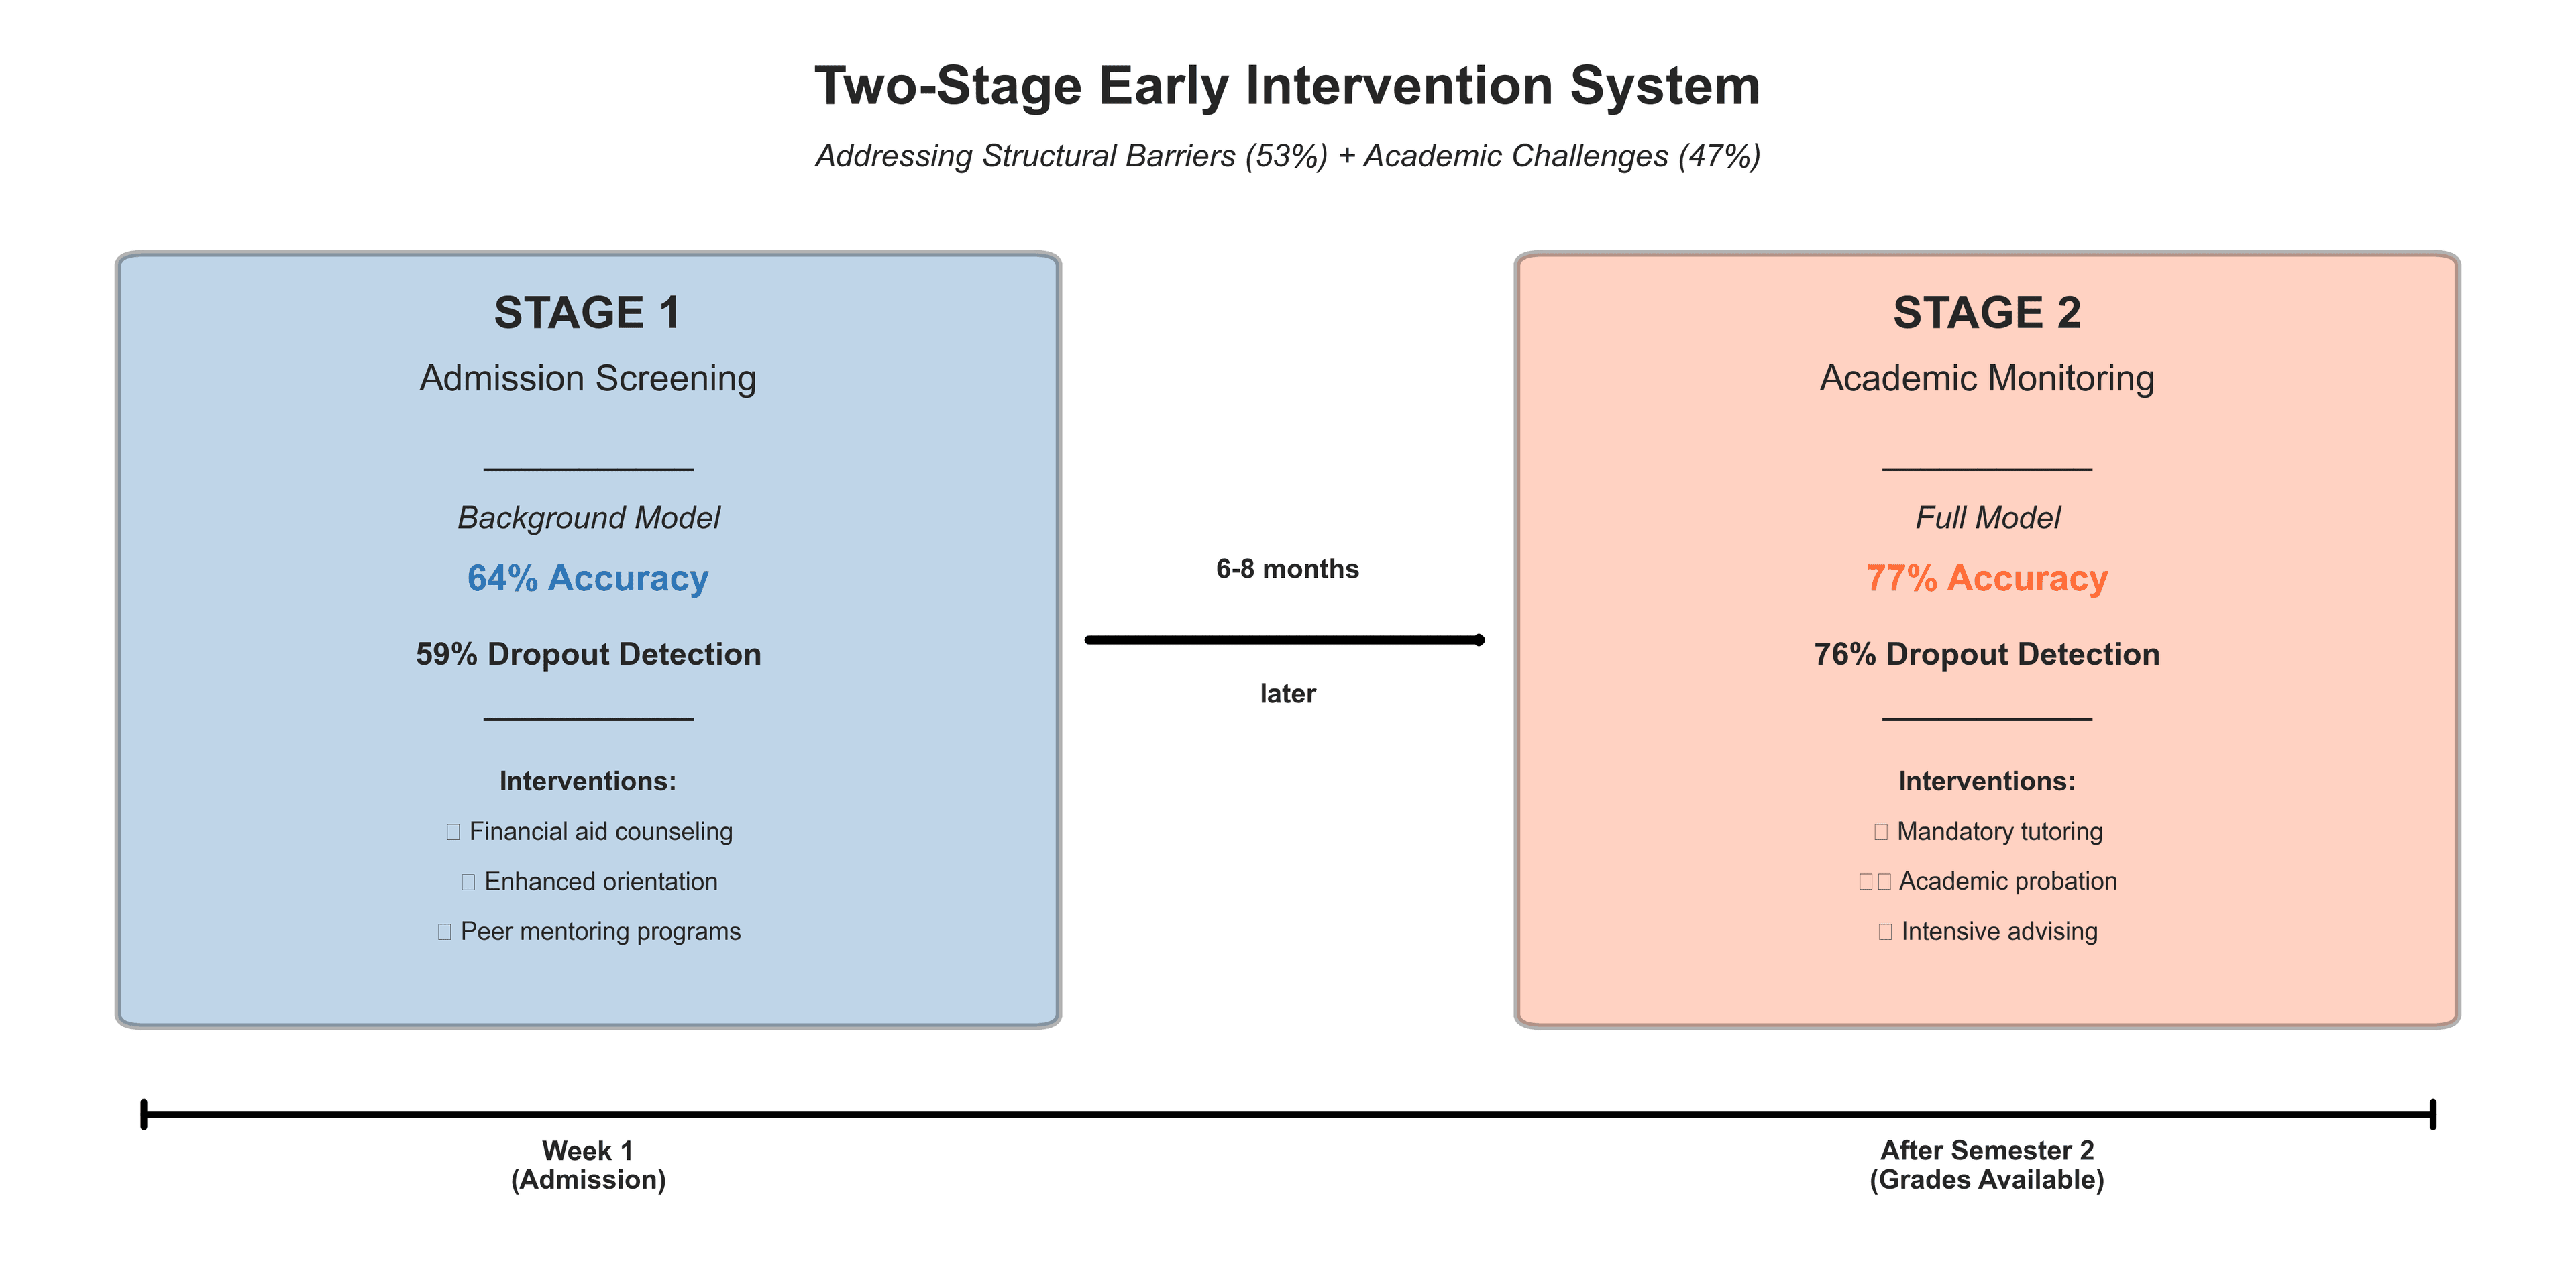
The 53/47 lift decomposition translates model performance into two possible moments for student support.
why these tools and choices
pandas + NumPy
Handled audit, category cleanup, feature engineering, and reproducible train/test preparation.
scikit-learn
Provided preprocessing pipelines, stratified validation, baselines, and comparable metrics across candidate models.
XGBoost
Won on held-out performance with the smallest CV-to-test gap among the leading models.
Jupyter + seaborn
Kept the analysis traceable and turned the model comparison into presentation-ready evidence.
Two models for two moments
The UCI dataset contains 4,424 students, 36 raw fields, and three outcomes: dropout, still enrolled, or graduate. I engineered five columns from semester performance and grouped high-cardinality categories before modeling.
The admission model deliberately excludes every semester grade and curricular-unit count. The full model adds those academic signals, so the comparison has a real temporal meaning.
Selecting for generalization
I compared a dummy baseline, logistic regression, random forest, gradient boosting, and XGBoost using a stratified train/test split and five-fold cross-validation.
XGBoost won by a small margin, and its 0.98-point CV-to-test gap was smaller than the runner-up’s 1.68-point gap.
Where the predictive lift came from
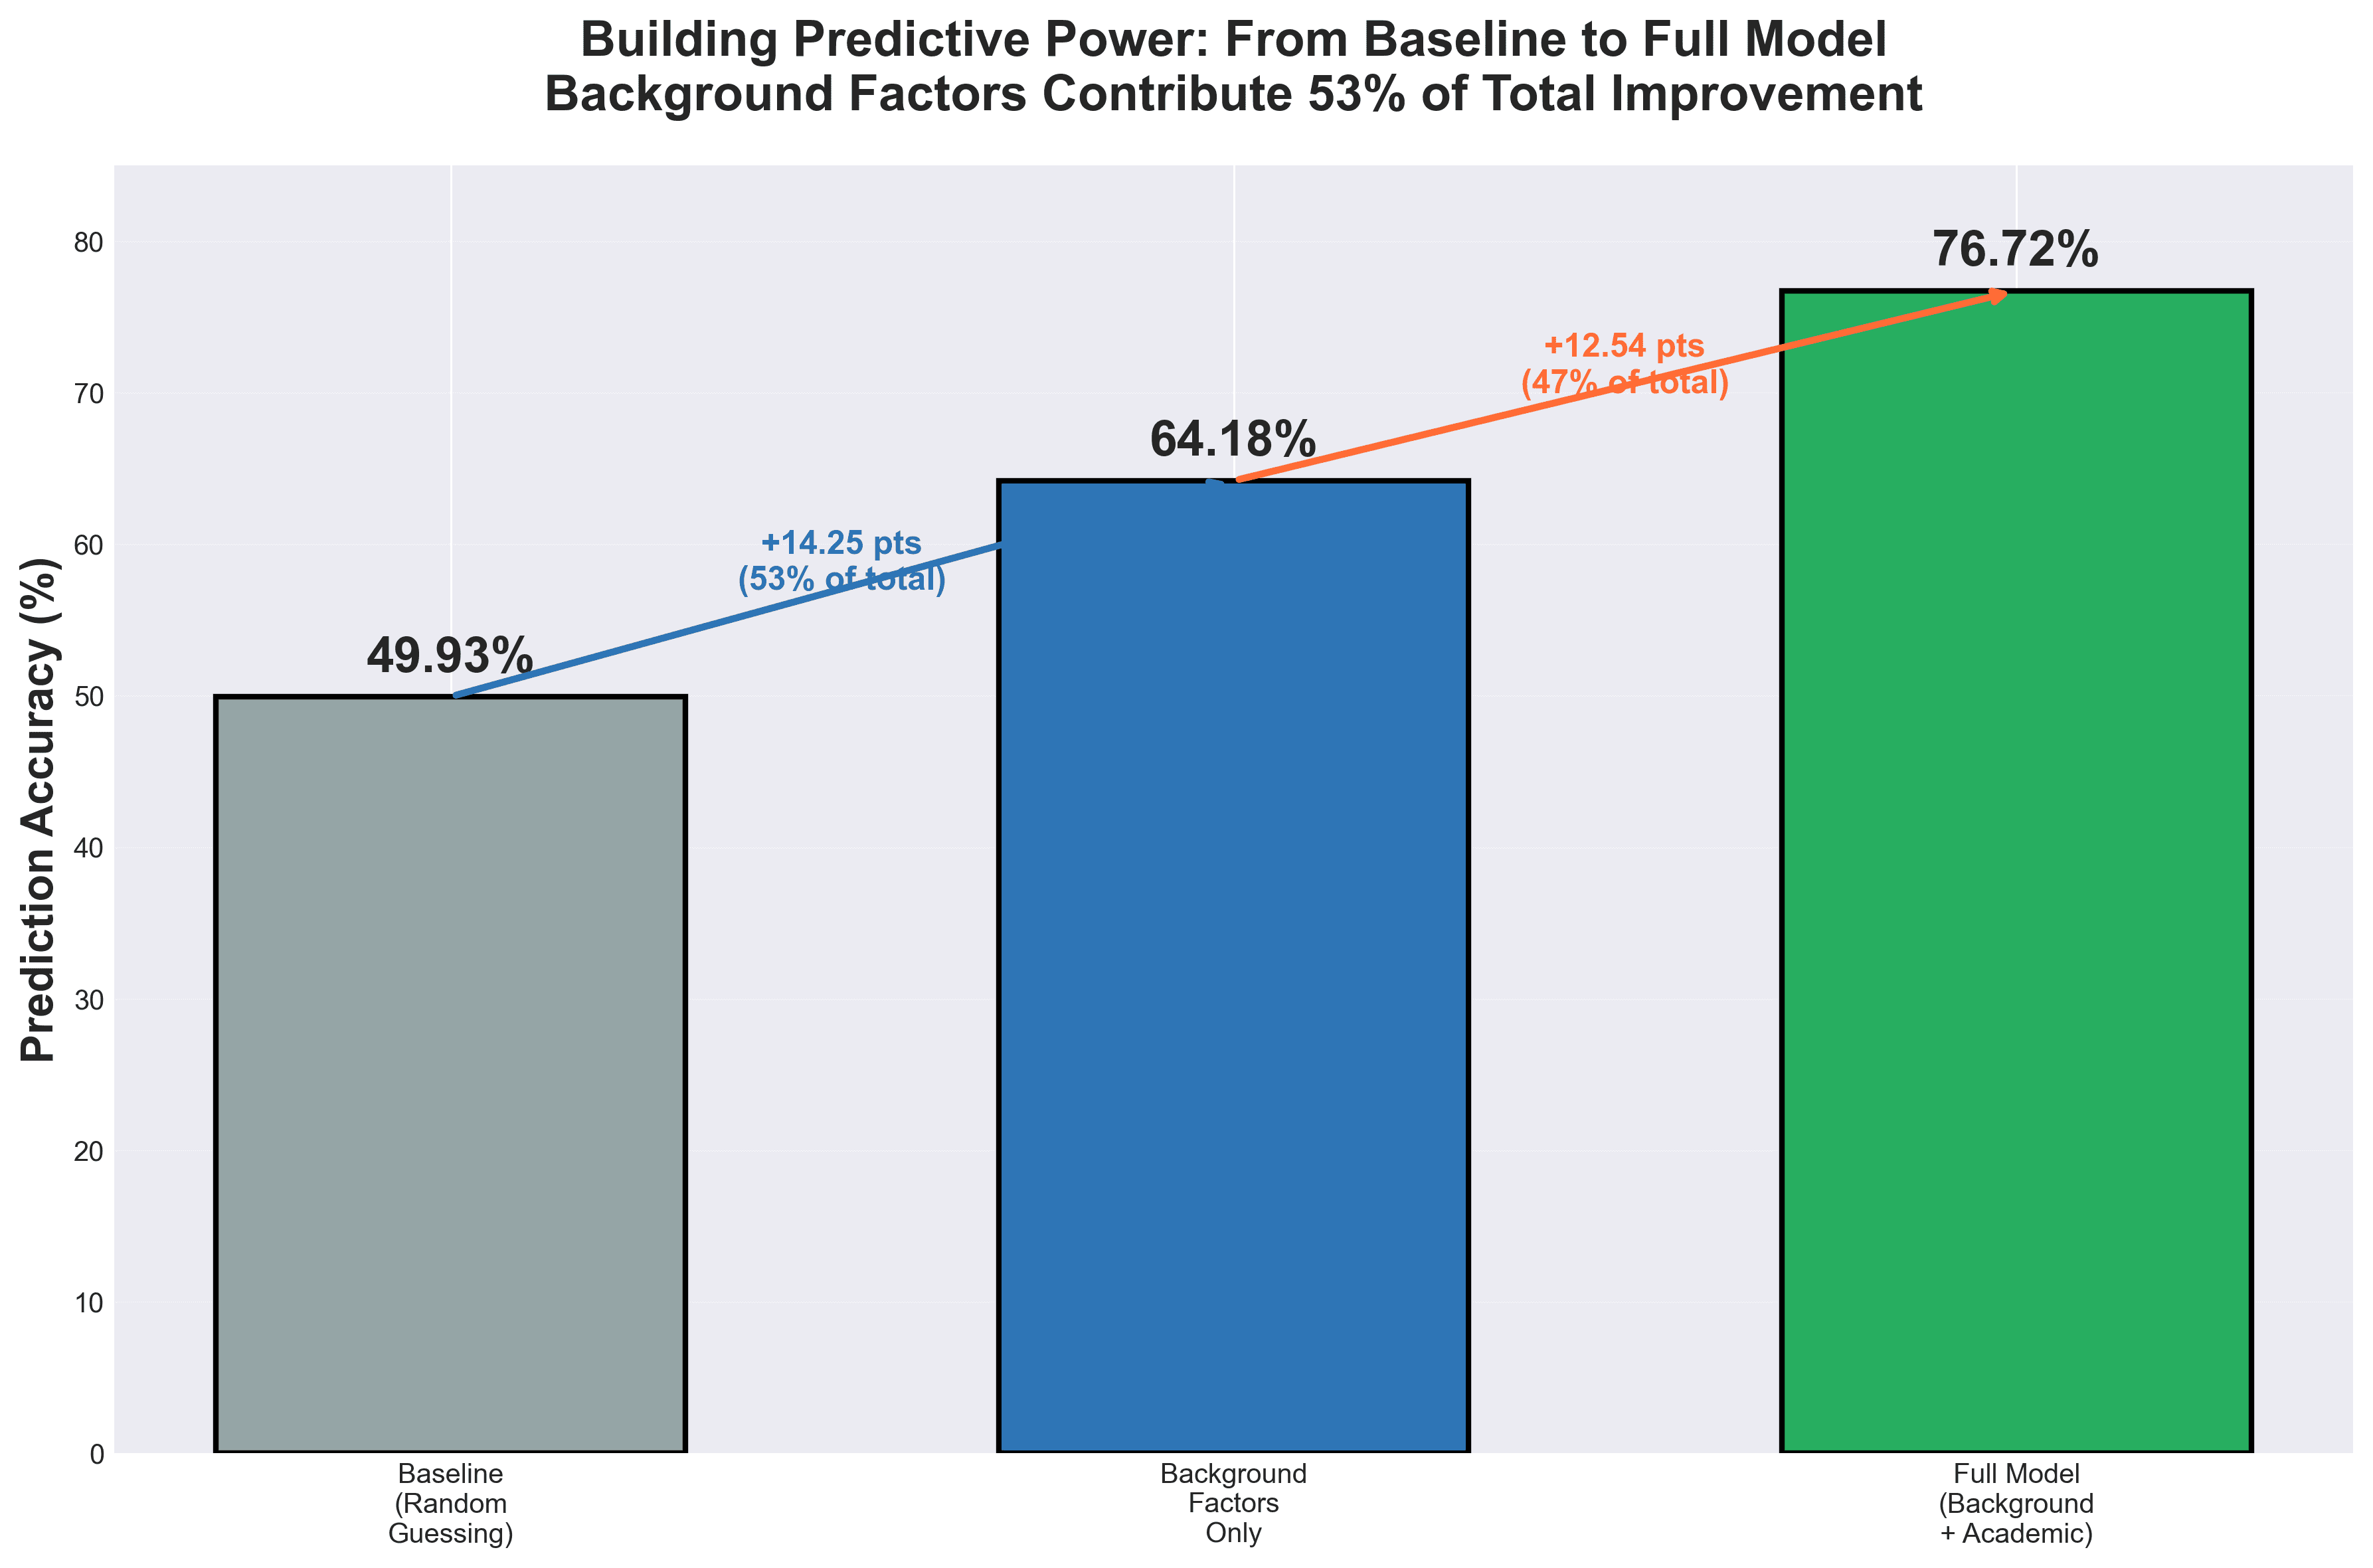
The majority baseline scored 49.93%. The admission model rose to 64.18%, and the full model reached 76.72%.
Attributing those gains proportionally gives 53.2% of the total lift to background and admission-time factors and 46.8% to academic performance. Structural context mattered slightly more than grades.
What I chose not to keep
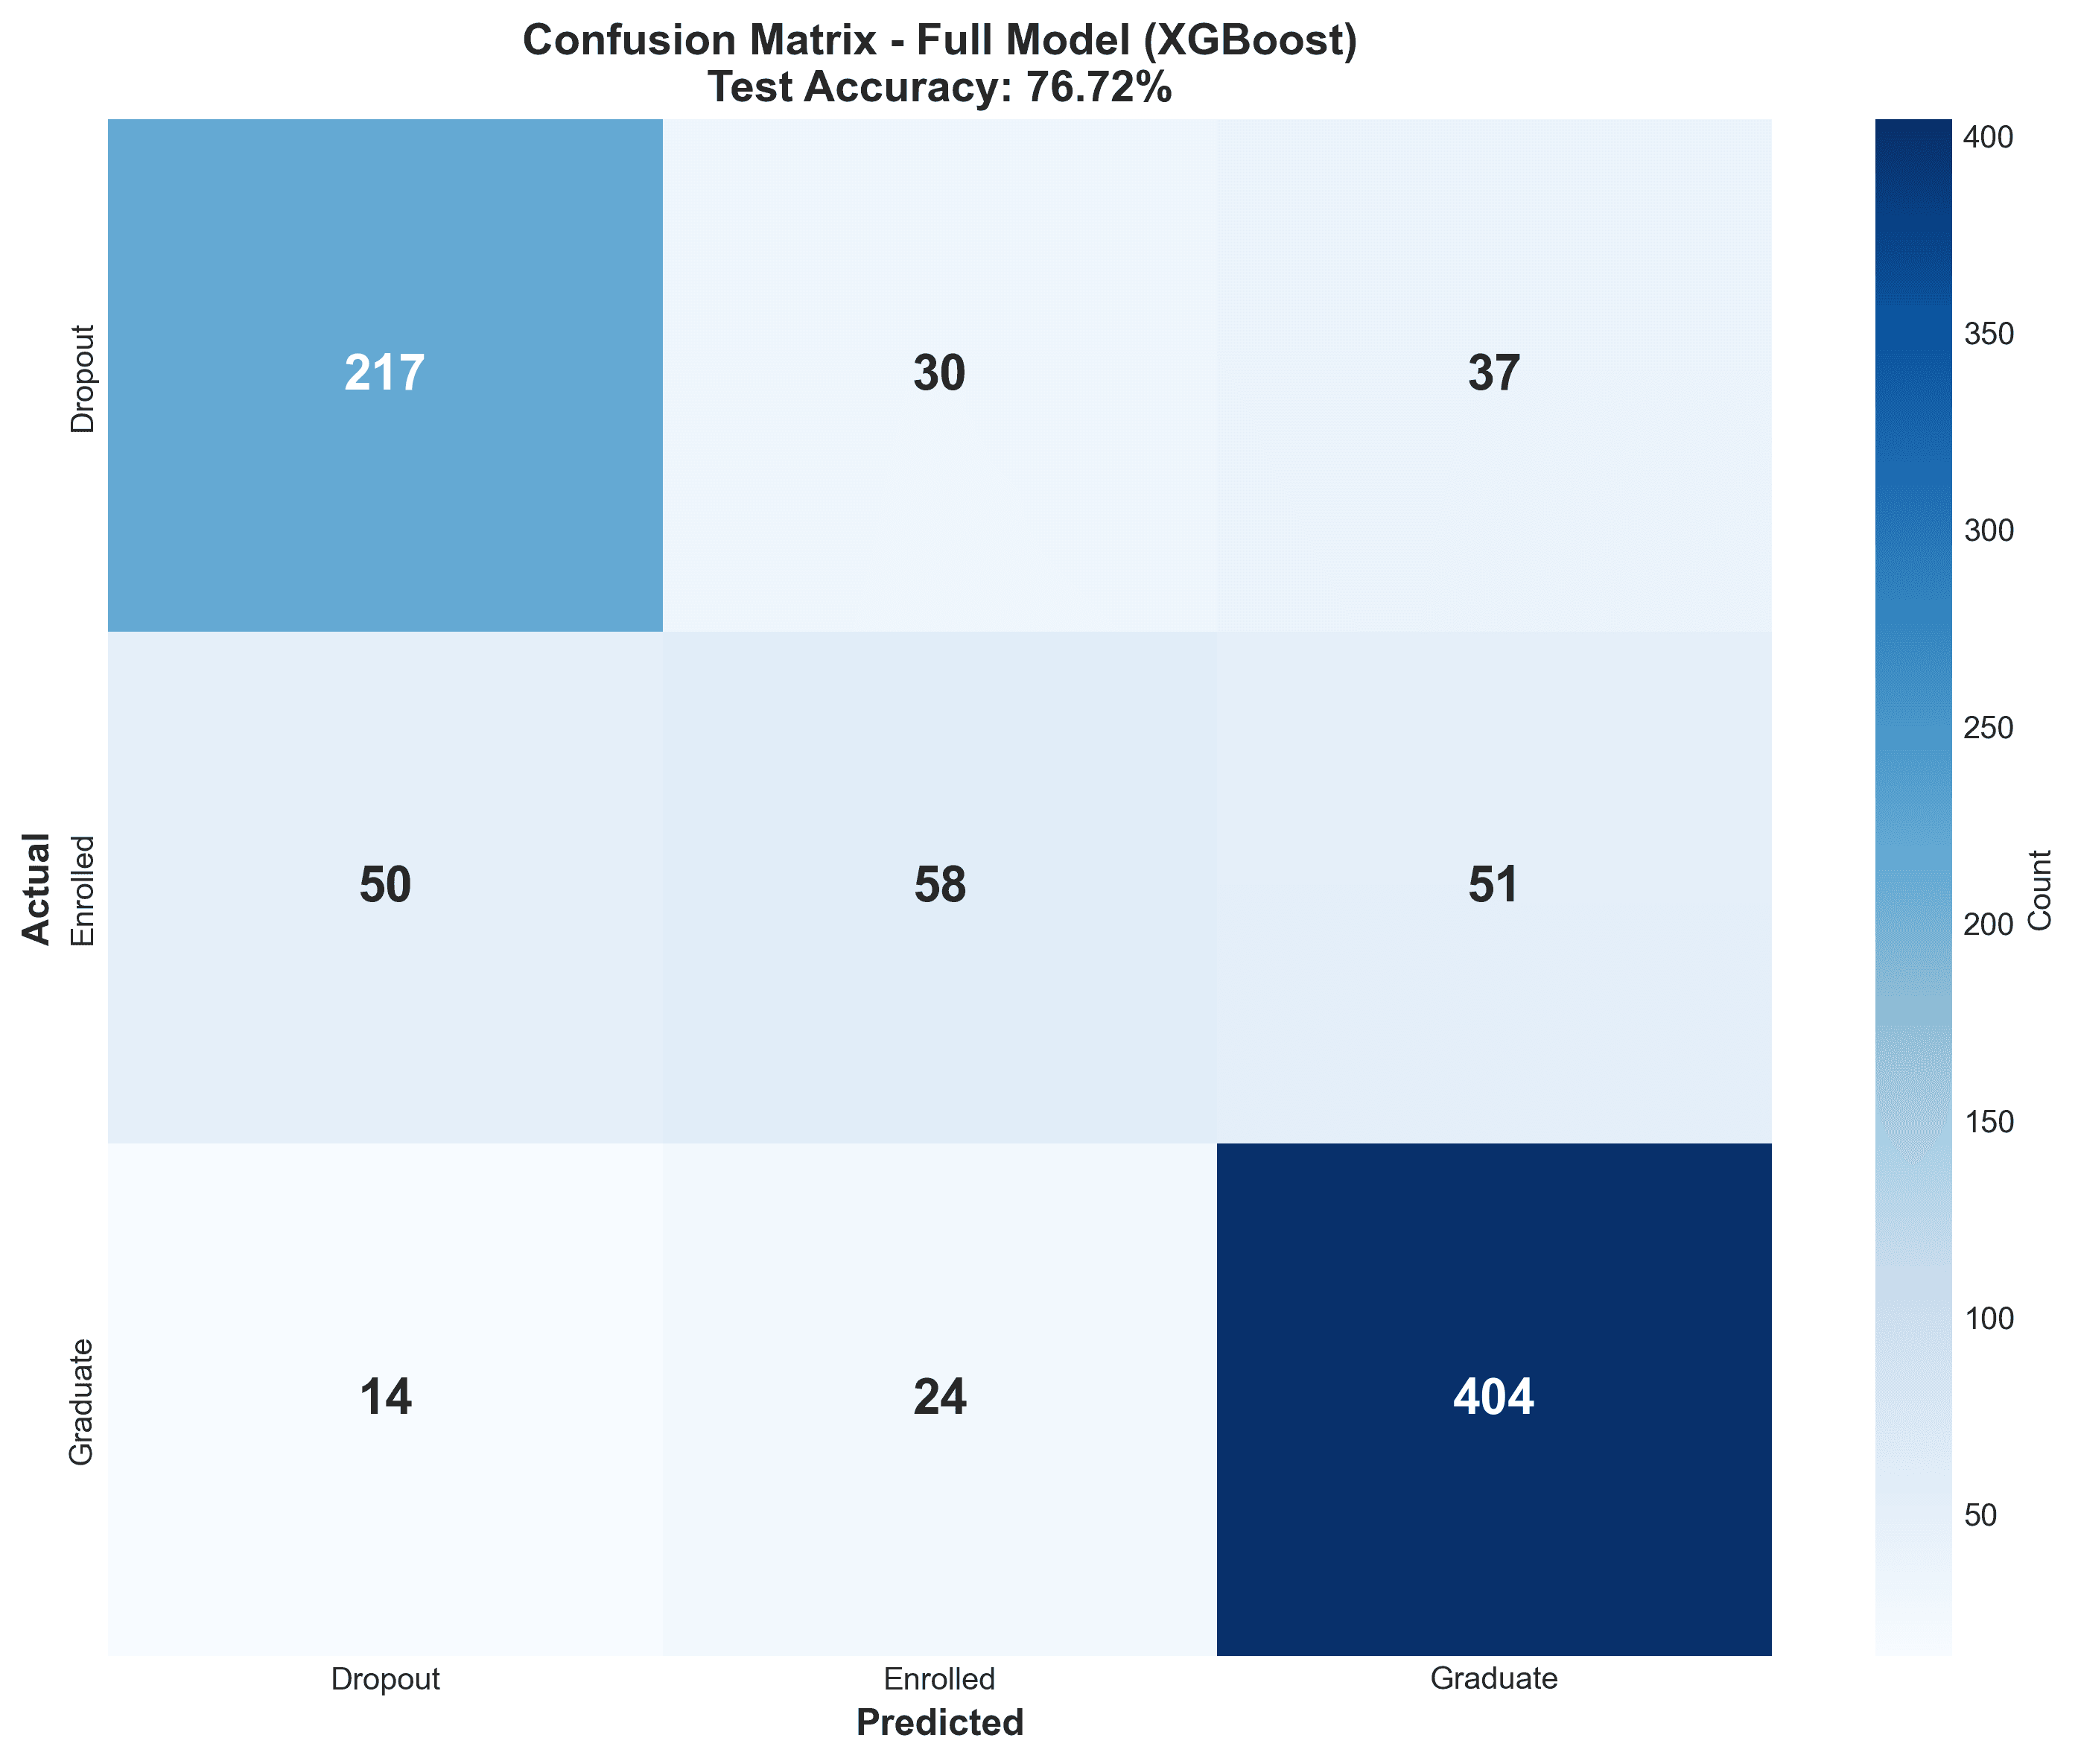
SMOTE made performance worse. Additional interaction features looked important but reduced held-out accuracy from 76.72% to 75.82%, suggesting overfitting on the 3,539-record training set.
Keeping those experiments in the final story mattered: the best model was simpler than several versions I tried along the way.
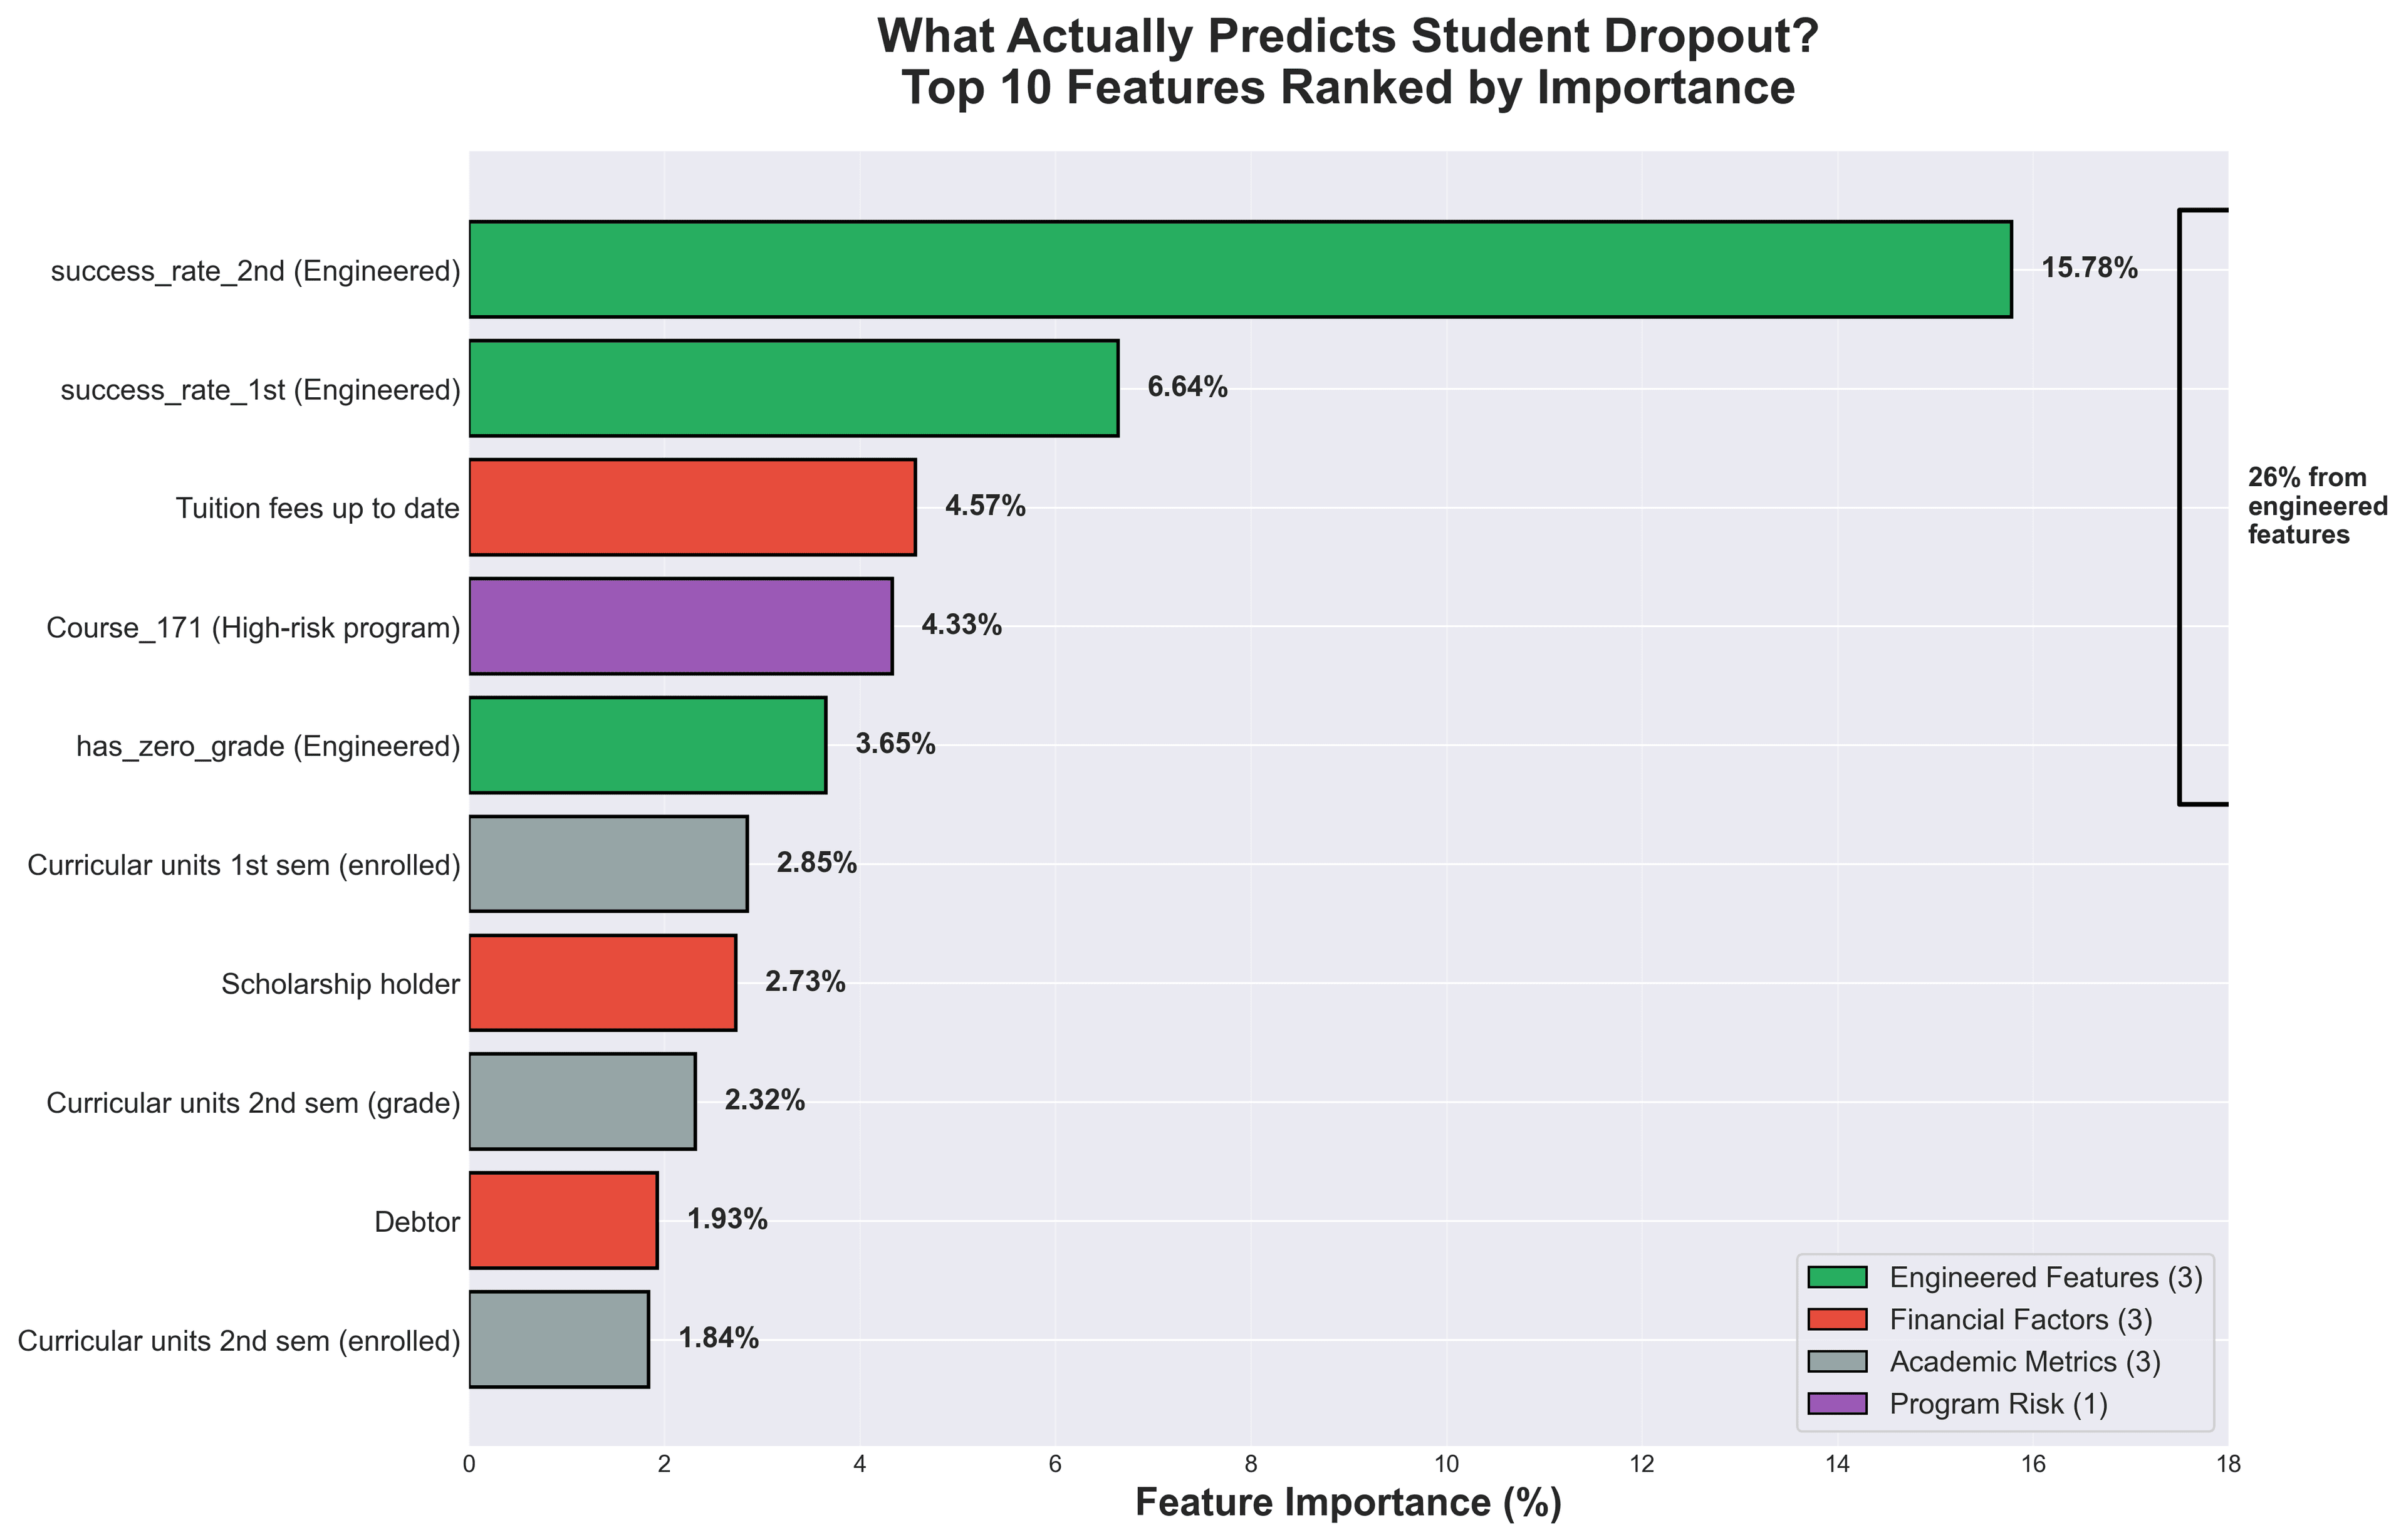
a solo project from question to interpretation
I owned the data audit, feature sets, preprocessing, candidate models, experiments, evaluation, charts, whitepaper, and presentation.
- Designed lifecycle-specific feature sets rather than one maximally predictive feature soup.
- Selected for generalization gap as well as headline accuracy.
- Kept the weaker enrolled-class result visible: the full model recalled only 36% of students still enrolled.
- Rejected SMOTE and extra interaction features when held-out performance worsened.
a few more pages from the process
results, with context
dropout recall
The full model correctly identified 217 of 284 dropout cases.
dropout precision
About three quarters of students flagged as dropout cases were correct.
early recall
The admission-only model reached this before semester grades existed.
The surprise was that the information available before classes began carried slightly more of the measured predictive lift than semester performance. I would next validate the approach on another institution and add careful explainability before anyone treated the output as an intervention tool. The two-stage framework remains a proposal, not a deployed system.